

Swati Tyagi
Senior Full Stack and Mobile App Developer
Master System Monitoring and Observability with Prometheus, Grafana, ELK, Loki and OpenTelemetry. Learn metrics, logs, distributed tracing, alerting, Kubernetes monitoring and SRE practices through live online labs and career support.
System Monitoring & Observability is what separates an engineering team that is firefighting blind from one that diagnoses production faults in minutes. When an API latency spike hits at 3am, you need more than a simple ping check; you need to trace the exact request path across distributed microservices, inspect aggregated container logs, and understand resource saturation before users notice a degradation. This hands-on program teaches you to build, configure, and operate a complete production-grade telemetry pipeline from the ground up.
You will start by mastering the fundamentals of system telemetry, Linux process inspection, and networking counters before moving into time-series data modeling with Prometheus and PromQL. From there, you will design actionable operational dashboards in Grafana, implement centralized log aggregation using the Elastic Stack and Grafana Loki, and instrument distributed tracing across applications with OpenTelemetry, Jaeger, and Tempo. You will also learn to handle alerts responsibly via Alertmanager, monitor container health inside Kubernetes with the kube-prometheus-stack, and govern reliability through rigorous SLIs, SLOs, and error budgets.
If you are a backend engineer, infrastructure specialist, or platform developer wanting to own reliability, this course provides the exact operational skills required. It pairs naturally with our comprehensive Linux training for foundational system knowledge, the Kubernetes: Beginner to Advanced course for container orchestration insights, the Google Cloud (GCP) training for cloud-native setups, and the DevOps & Automation Bootcamp for full-lifecycle delivery pipelines.
Sessions run live online in interactive cohorts featuring hands-on lab environments, direct code and architecture reviews from practising engineers, and structured troubleshooting sessions. You learn by breaking and fixing real systems rather than just watching slides, ensuring you gain the practical intuition needed for high-stakes environments.
The job market for observability and site reliability skills is expanding rapidly across remote-first companies and product engineering teams. Hiring loops for DevOps Engineer, Site Reliability Engineer, and Platform Engineer roles routinely test your ability to diagnose cascading failures, write efficient queries, and design sensible alerts. This program prepares you directly for those technical rounds through mock interviews, architecture whiteboarding practice, and resume reviews.
Take the next step in your engineering career and master System Monitoring & Observability with Squarebrackets today.
A structured curriculum with real tools and outcomes built for the workplace.
You can explain the difference between monitoring and observability and identify which of the three pillars solves a given production failure.
Hands-on project: Produce an architecture document and gap analysis for a legacy 3-tier web service, mapping its failure modes against metrics, logs, and traces.
You can deploy Prometheus, write complex PromQL queries, and scrape application metrics using custom exporters.
Hands-on project: Configure a Prometheus server in a Docker container to scrape a custom Node.js application and a node_exporter daemon, enforcing a 15-second scrape interval and custom retention rules.
You can build production-ready Grafana dashboards with template variables, annotations, and multi-source panels.
Hands-on project: Build an executive Grafana dashboard connected to Prometheus that visualizes CPU saturation, memory leaks, request latency percentiles, and database connection pool exhaustion using dynamic templated dropdowns.
You can centralize, parse, and query high-volume application logs using Elasticsearch, Logstash, Kibana, and Grafana Loki.
Hands-on project: Deploy a Grafana Loki and Promtail pipeline alongside Logstash to ingest JSON access logs, parse nested error fields, and construct saved searches in Kibana and Loki LogQL streams.
You can instrument microservices with OpenTelemetry, propagate trace contexts across network boundaries, and analyze bottlenecks in Jaeger and Tempo.
Hands-on project: Instrument a multi-service Python and Go application using OpenTelemetry SDKs, configure the OpenTelemetry Collector to batch spans, and trace a distributed transaction end-to-end in Jaeger.
You can configure Alertmanager routing trees, write symptoms-based alert rules, and integrate notification channels to minimize alert fatigue.
Hands-on project: Build a Prometheus alerting rule set with Alertmanager routing configuration that sends high-severity pages to PagerDuty and warning alerts to a Slack channel, incorporating inhibition rules to silence cascading alarms.
You can apply the RED and USE methodologies to profile application performance and track throughput, latency, and error rates.
Hands-on project: Instrument a production web service with Datadog APM, capture custom database query spans, and set up an anomaly detection monitor for HTTP latency spikes.
You can monitor host infrastructure and cloud services across AWS, Azure, and GCP using native and open-source tooling.
Hands-on project: Configure AWS CloudWatch alarms and metric streams to export EC2 and RDS performance data into a centralized Prometheus and Grafana monitoring instance.
You can deploy the kube-prometheus-stack to monitor pods, nodes, persistent volumes, and Kubernetes control plane components.
Hands-on project: Deploy the Prometheus Operator via Helm onto a multi-node Kubernetes cluster, configuring ServiceMonitors for custom applications and establishing resource quota alerts for namespaces.
You can define Service Level Indicators, SLOs, and error budgets, and conduct blameless postmortems after incidents.
Hands-on project: Write an SLO definition document for a core authentication microservice, calculate burn rate alert thresholds, and author a blameless postmortem template complete with action items.
You can forecast capacity from your own metrics and stop an observability bill from outgrowing the service.
Hands-on project: Use historical Prometheus data to forecast when a service exhausts headroom, then cut observability spend: drop high-cardinality labels, set per-tier retention and downsampling, and report the reduction in series count and storage.
You can detect an outage before a user reports it, and prove the system survives a failure you chose.
Hands-on project: Add synthetic checks for the critical user journey from two regions with alerting on failure, then run a controlled chaos experiment that kills a dependency, and document the hypothesis, blast radius and what the experiment revealed.
You can design, deploy, and operate a complete production-grade monitoring, logging, and tracing stack with defined SLOs and incident runbooks.
Hands-on project: Deploy an end-to-end observability stack on Kubernetes containing Prometheus, Grafana, Loki, and OpenTelemetry, instrumented against a microservices application, configured with PagerDuty alerts, and documented with an operational runbook for portfolio review.
Every instructor here ships production code for a living and teaches the same week they deploy.
5 learners sharing their experience

The Full-Stack Java developer program at Squarebrackets completely transformed my career. Learning Spring Boot and microservices architecture alongside React and Next.js gave me the exact modern stack companies are looking for. Building real-time projects using Apache Kafka and RabbitMQ for message queuing gave me the practical confidence I needed to ace my system design rounds.
Ankit transitioned from a legacy support engineer to a high-paying product development role after completing his 6-month intensive Java and JavaScript full-stack training at our Noida campus.

Squarebrackets took me from not knowing what a gradient was to building and deploying CNNs and Transformers. The maths-first approach made everything click, and the mentors pushed me through every hard concept.
Completed the Deep Learning Course at Squarebrackets and landed a deep learning role within two months.

Squarebrackets gave me the complete AI picture — from search algorithms and Bayesian reasoning to building LLM agents. The maths-first approach meant nothing was a black box, and the mentors pushed me through every project.
Completed the Artificial Intelligence Course at Squarebrackets and moved into an AI engineering role within two months.

The Java Full-Stack and DSA course at Squarebrackets completely changed my career trajectory. The focus on raw problem-solving with DSA alongside hands-on Spring Boot and React projects gave me the practical skills I needed. I went from struggling with basic coding rounds to cracking my technical interview with absolute confidence.
Aniket joined Squarebrackets as a college senior looking to transition from theoretical academic projects to production-ready software development. After completing our rigorous training program, he secured a placement as an Associate Software Engineer.
The live cohort broke down complex concepts like Spring Boot transaction management and React state handling in a way that made immediate sense for production work. Having worked through real backend architectures during class, my daily code reviews at work became much smoother.
Completed the Java Full Stack live training while balancing a full-time role, upgrading engineering skills through rigorous hands-on sessions.

“The Full-Stack Java developer program at Squarebrackets completely transformed my career. Learning Spring Boot and microservices architecture alongside React and Next.js gave me the exact modern stack companies are looking for. Building real-time projects using Apache Kafka and RabbitMQ for message queuing gave me the practical confidence I needed to ace my system design rounds.”

Software Engineer, Student
“Squarebrackets took me from not knowing what a gradient was to building and deploying CNNs and Transformers. The maths-first approach made everything click, and the mentors pushed me through every hard concept.”

Student
“Squarebrackets gave me the complete AI picture — from search algorithms and Bayesian reasoning to building LLM agents. The maths-first approach meant nothing was a black box, and the mentors pushed me through every project.”

Student
“The Java Full-Stack and DSA course at Squarebrackets completely changed my career trajectory. The focus on raw problem-solving with DSA alongside hands-on Spring Boot and React projects gave me the practical skills I needed. I went from struggling with basic coding rounds to cracking my technical interview with absolute confidence.”
Associate Software Engineer, Capgemini
“The live cohort broke down complex concepts like Spring Boot transaction management and React state handling in a way that made immediate sense for production work. Having worked through real backend architectures during class, my daily code reviews at work became much smoother.”

Student


Browse the common questions, or reach out and our team will help you directly.
10 courses in this collection
Microsoft Azure Solutions Architect & DevOps Expert (AZ-900, AZ-305, AZ-400) Beginner24 Weeks
Advanced DevOps and Infrastructure Engineering Course Beginner22 Weeks
Docker — From Zero to Production Intermediate12 Weeks (93 Hours)
Google Cloud (GCP) Advanced5 Months (20 Weeks)
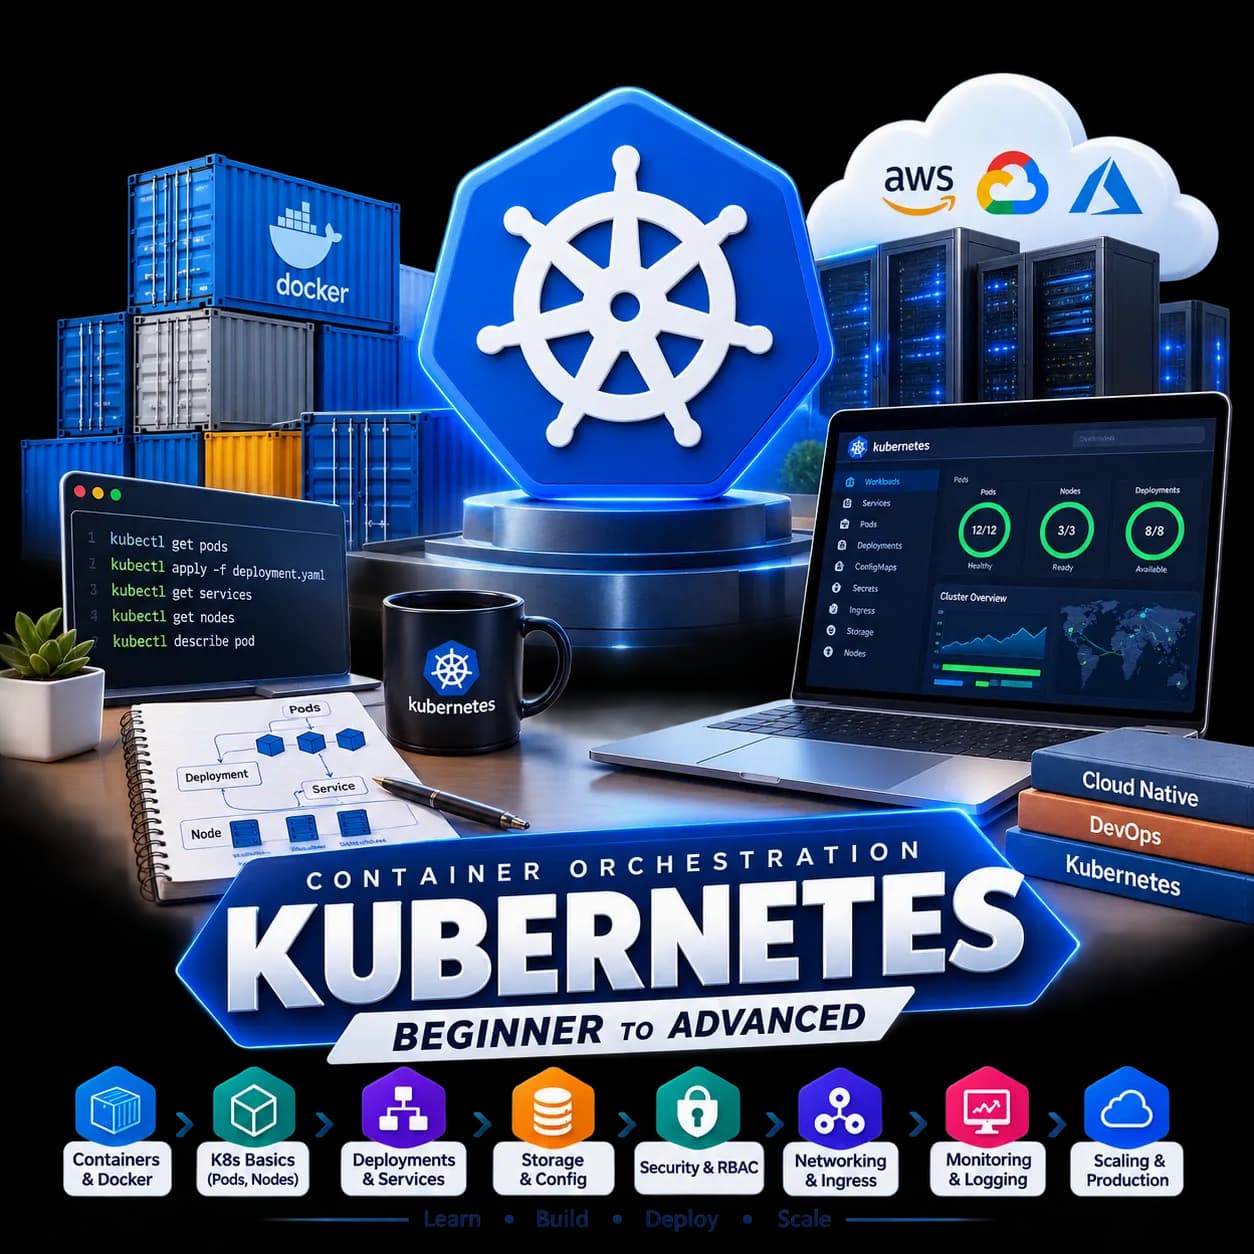
Kubernetes: Beginner to Advanced Advanced8–12 weeks
Azure Cloud Advanced5 Months (20 Weeks)
Linux Intermediate3 Months (12 Weeks)
Git & GitHub Advanced12 Weeks (90 Hours)

Jenkins Intermediate3 Months (12 Weeks)
AWS Cloud Advanced5 Months (20 Weeks)
Best seller
Best seller
Best seller
New
Best seller
New
New
New
Trending
NewHands-on programming tracks with runnable code, from fundamentals to job-ready projects.
Kubernetes Beginner to Production Grade: A Hands-On DevOps Guide Beginner25 min
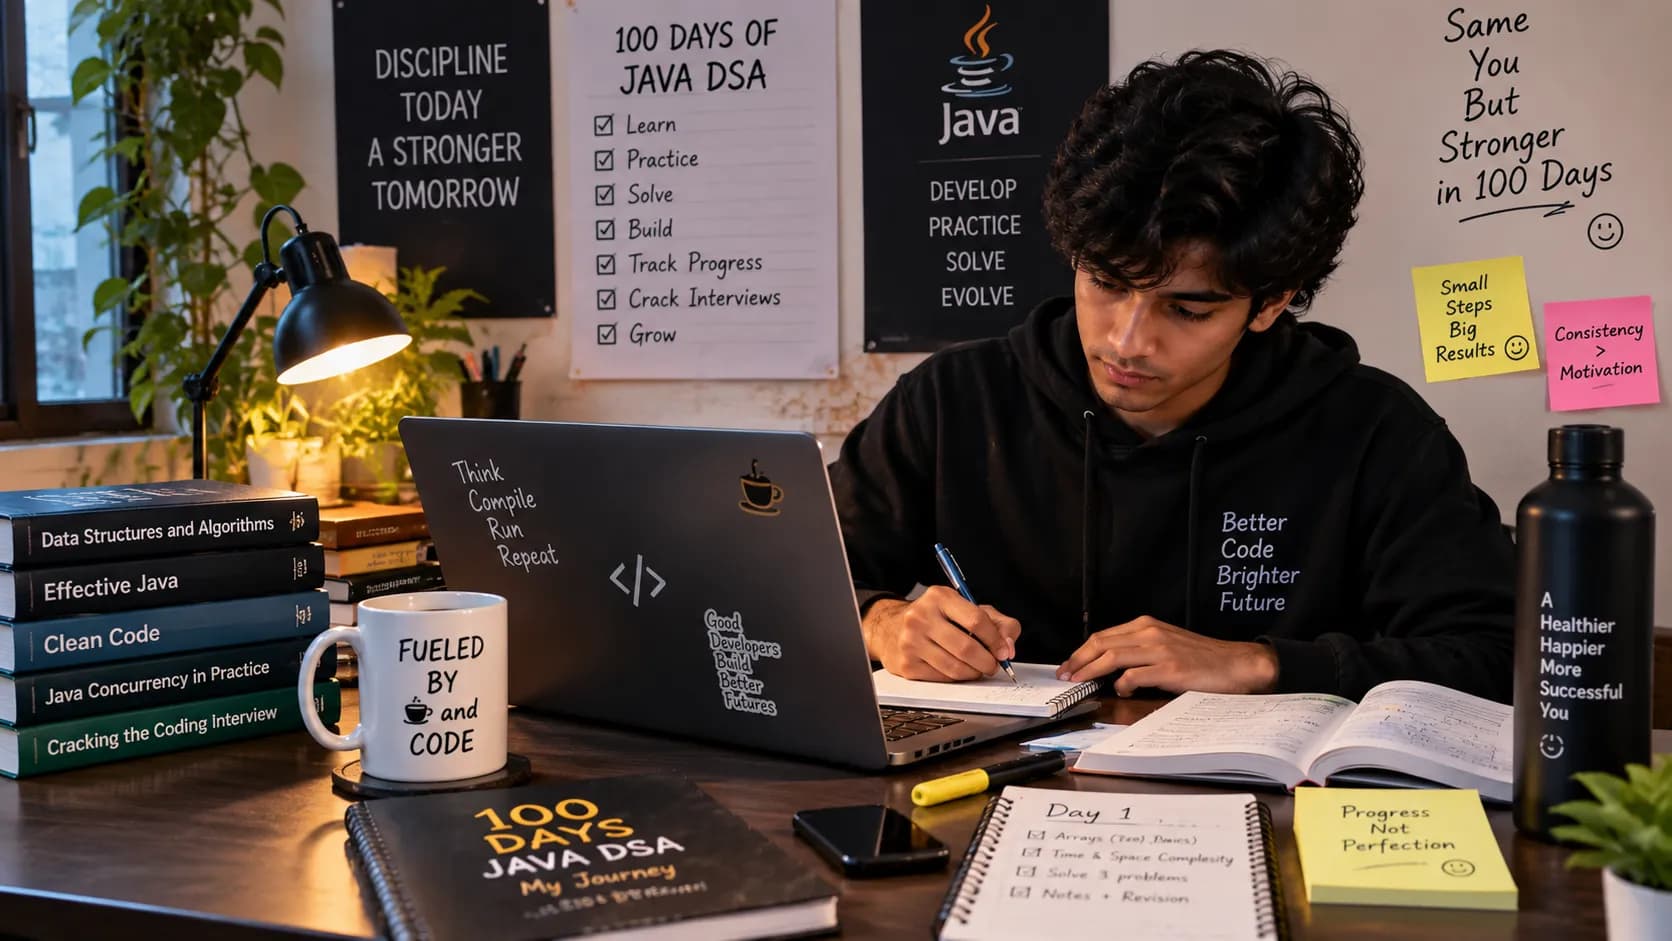
100 Days of DSA with Java Beginner to advanced100 days · 85 lessons published

100 Days of AI Engineering Beginner to advanced100 days · 57 lessons published


Articles to help you learn, grow, and get hired.
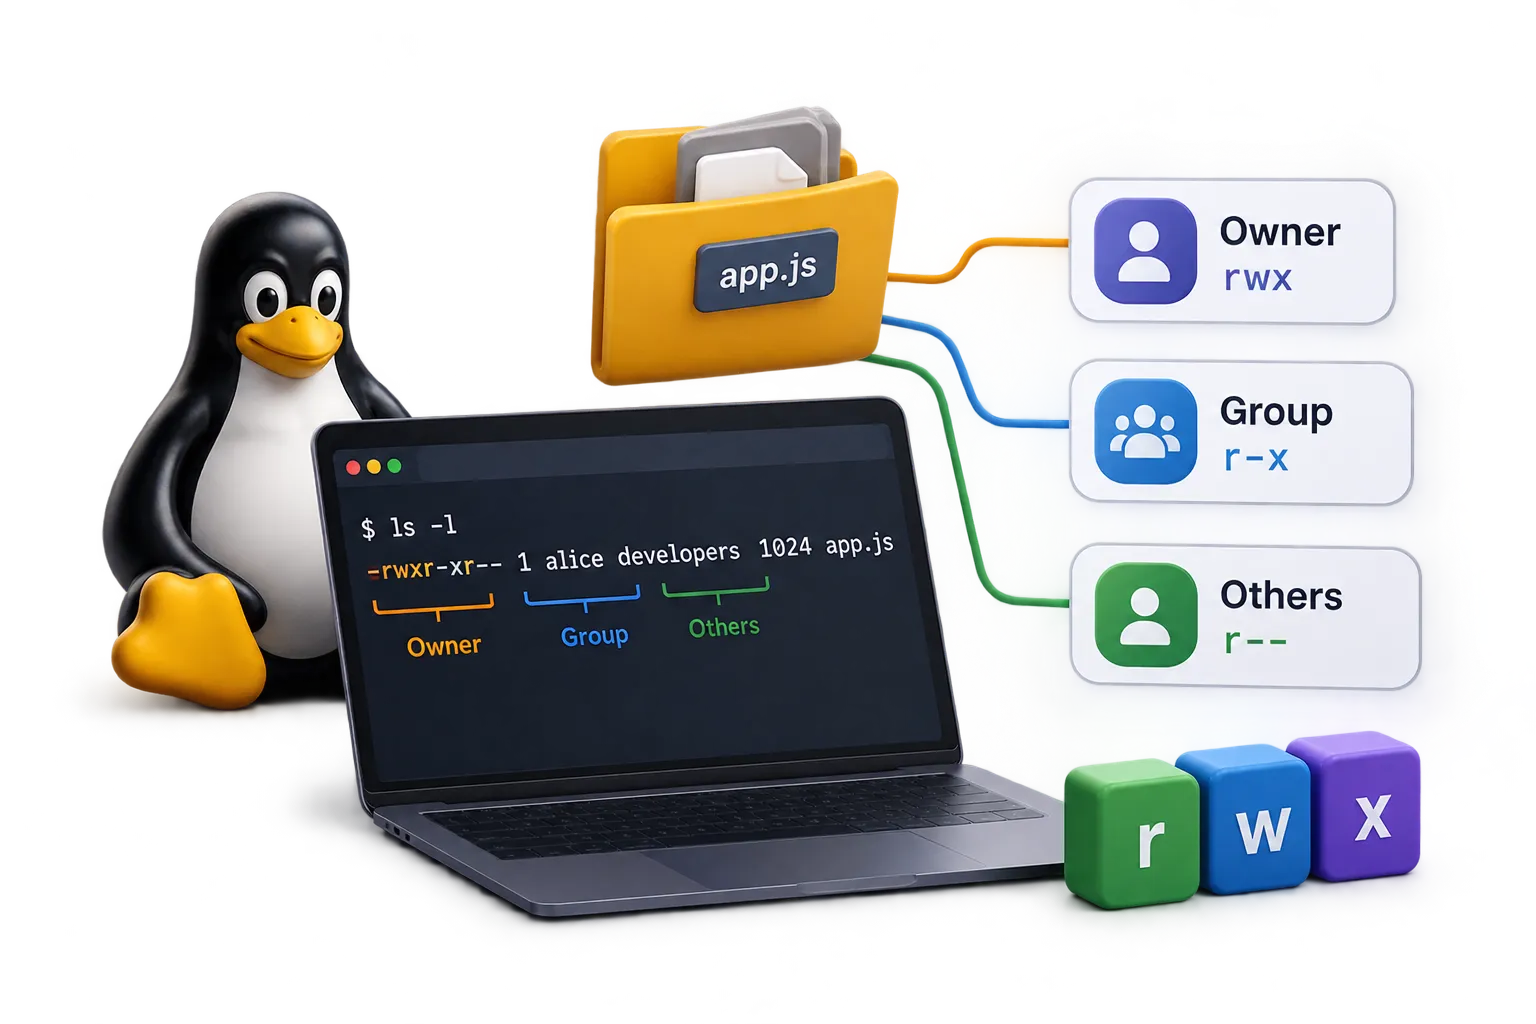
Linux Groups and File Permission: Complete Admin Guide 5 min11 Sept 2026

Terraform Architecture Explained: How It Works Under the Hood 5 min9 Sept 2026
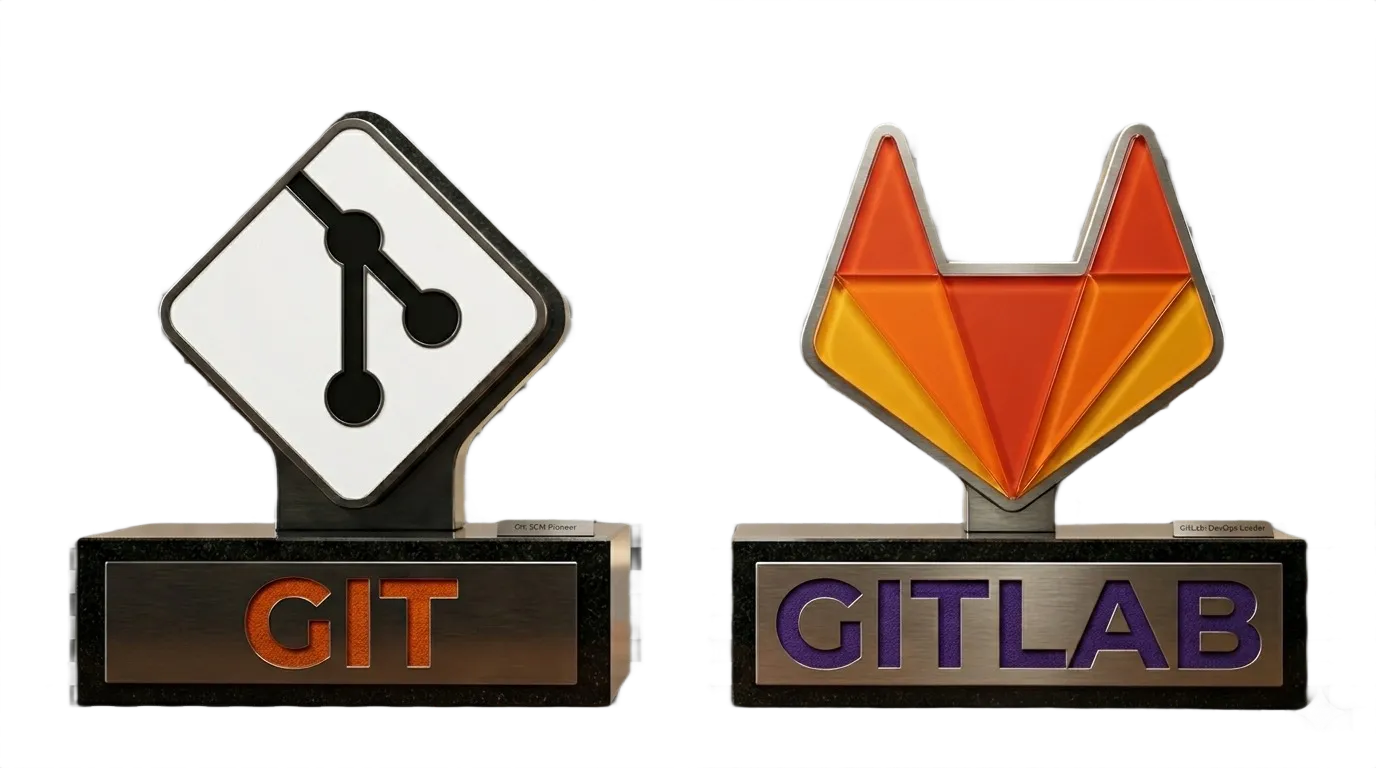
Git vs GitLab: What's the Difference? (Simple Guide for Beginners) 5 min23 Jun 2026
Master Linux groups and File Permission with this practical guide covering user creation, group memberships, sudo privileges, and file permissions.

Demystify Terraform architecture. Learn how the Core, State files, Providers, and APIs interact to manage Infrastructure as Code safely.
TrendingA beginner-friendly guide to the real difference between Git and GitLab, explained in plain English with a simple real-life example anyone can understand.